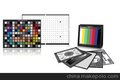
ITE Inmega Cycle Chart for High-definition TV Systems

- This is a Test Chart for flaw detection.
- The test chart is distinguished into 3 parts as follows:
(1)AreaⅠ is inside of the circle 'h' in diameter.
(2)AreaⅡ is inside of the circle '√2h' in diameter.
(3)AreaⅢ is rest of the image. - The thinnest line is used for separator line.
- This chart is only available for transparent type.
Effective AreaOuter Size
Transparent Type| 272×153 | 310×200
|